Australia LNG Market Hits 81M Tons : Ken Research Reveals Asian Demand Driving 8.1% Growth
Australia LNG Market Hits 81M Tons in 2024: Ken Research Finds Asian Demand Powering 8.1% Growth | Ken Research
Executive Summary
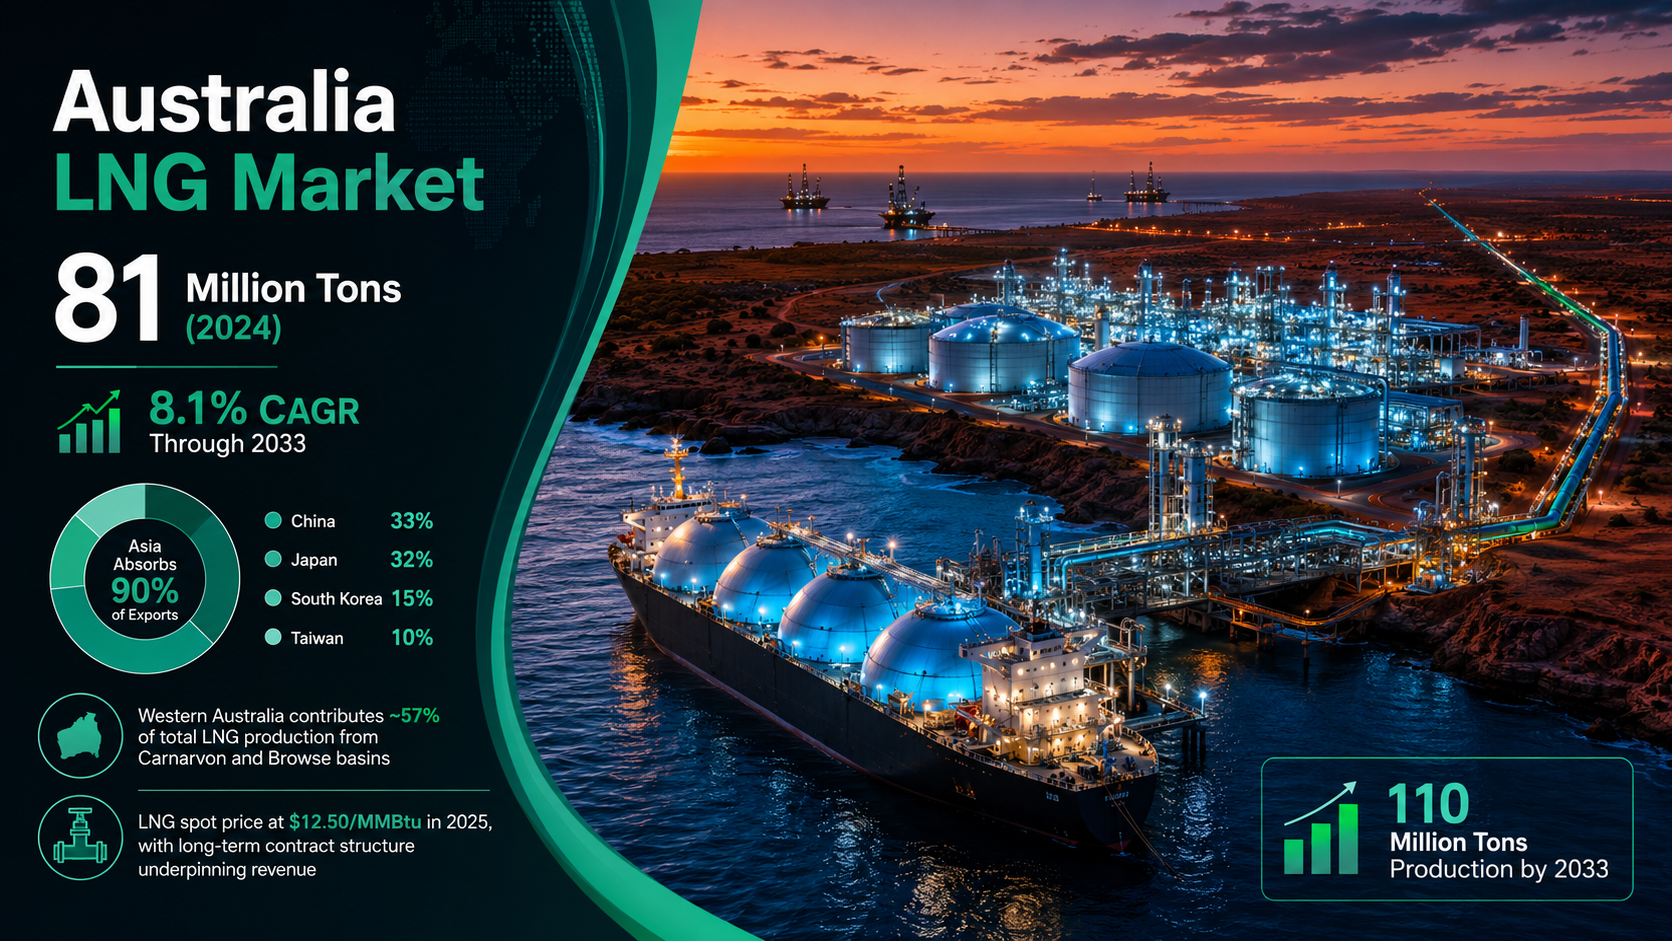
Australia's liquefied natural gas sector stands at a defining inflection point. With production capacity reaching 81 million tons in 2024 and domestic consumption at 8.1 million tons, the country commands roughly one-fifth of global LNG trade. Ken Research finds the market is forecast to expand at a 8.1% CAGR through 2033, with production capacity rising to 110 million tons and domestic consumption reaching 17.2 million tons by the same year. The primary engine is Asia-Pacific energy demand, with China absorbing 33%, Japan 32%, South Korea 15%, and Taiwan 10% of all Australian LNG exports. LNG export earnings are projected at $65 billion in 2024-25, underpinned by long-term contractual frameworks that insulate operators from spot price volatility. Western Australia accounts for roughly 57% of national production, anchored by the Gorgon, Wheatstone, North West Shelf, and Pluto facilities situated in the prolific Carnarvon and Browse basins.
Key Takeaways
- Australia's LNG production capacity is 81 million tons in 2024, rising to 110 million tons by 2033 at a 8.1% CAGR
- Domestic LNG consumption grows from 8.1 million tons to 17.2 million tons by 2033, doubling in under a decade
- LNG export earnings reach $65 billion in 2024-25, making it Australia's second-largest export commodity
- Asia-Pacific absorbs over 90% of exports, led by China (33%), Japan (32%), South Korea (15%), and Taiwan (10%)
- Western Australia contributes approximately 57% of total production from its offshore basins
- LNG spot prices stand at $12.50/MMBtu in 2025, forecast to ease to around $11/MMBtu by 2027
- Australia accounts for one-fifth of global LNG trade, on par with US and Qatar export volumes
Market At A Glance
- Production Capacity (2024): 81 million tons
- Domestic Consumption (2024): 8.1 million tons
- CAGR (2024-2033): 8.1%
- Production Forecast (2033): 110 million tons
- Consumption Forecast (2033): 17.2 million tons
- Export Earnings (2024-25): $65 billion
- LNG Spot Price (2025): $12.50/MMBtu
- Western Australia Share: ~57% of total production
- Global Trade Share: ~20% of global LNG trade
- Top Export Destination: China at 33% of exports
Asia-Pacific Demand: The Structural Tailwind Driving Australia's LNG Expansion
The structural growth story for Australian LNG is inseparable from Asia's energy transition. China's industrial economy and rapid urbanization position it as the single largest buyer at 33% of Australian LNG exports, while Japan's continued reliance on gas-fired generation following the 2011 nuclear policy shift sustains its 32% share. South Korea and Taiwan together contribute a further 25%, meaning four Asian economies alone absorb nearly 90% of Australia's total LNG output. Ken Research analysis confirms this demand concentration offers both resilience and risk, as contract renewal cycles in the 2035-2040 window will determine whether Australia retains its dominant trade position against rising competition from the United States and Qatar. Meanwhile, Southeast Asian import growth from emerging economies such as Vietnam, the Philippines, and Bangladesh is expected to add incremental demand, partially offsetting contract roll-off risks and sustaining volumes through the forecast horizon.
- China imports 33% of Australian LNG output, driven by industrial demand and urban gas network expansion
- Japan maintains 32% of import share, underpinned by 30+ long-term supply agreements averaging 15-20 years
- South Korea and Taiwan together account for 25% of exports, with power generation as the primary end-use
- Southeast Asian demand is emerging as a complementary growth vector, with Vietnam and the Philippines adding new LNG import terminals
- Global LNG demand is forecast to grow at approximately 4% annually through 2030, per IEA projections
Western Australia's Basin Dominance and Infrastructure Moat
Western Australia's Carnarvon and Browse basins constitute one of the world's densest concentrations of gas-producing infrastructure, generating roughly 57% of Australia's total LNG output. The Gorgon project, operated from Barrow Island, represents a $54 billion capital investment and operates three LNG trains with a combined nameplate capacity of 15.6 million tons per annum. Wheatstone adds another 8.9 million tons per annum, while North West Shelf retains capacity of approximately 16.9 million tons per annum despite progressive aging. The geographic concentration of these assets within 1,200-1,500 nautical miles of Asian import terminals gives Australian cargoes a natural freight advantage of 5-7 days over competing suppliers from the Atlantic Basin. This proximity, combined with the regulatory stability of Australia's offshore resource framework under the Offshore Petroleum and Greenhouse Gas Storage Act, underpins the premium pricing that Australian producers command in long-term contract negotiations. Ken Research tracks complementary gas infrastructure growth across Southeast Asia, providing context for the downstream demand that Australian supply serves.
- Western Australia accounts for approximately 57% of national LNG production, the highest regional concentration globally
- Gorgon operates 3 LNG trains with a combined capacity of 15.6 million tons per annum
- North West Shelf retains capacity of 16.9 million tons per annum from 5 operational LNG trains
- Wheatstone contributes 8.9 million tons per annum from 2 processing trains
- Australian LNG freight advantage: 5-7 days shorter voyage to Japan and Korea versus US Gulf Coast suppliers
- Floating LNG (FLNG) technology represents the next wave, with the Prelude FLNG vessel having an installed capacity of 3.6 million tons per annum
Competitive Landscape and Export Earnings Trajectory
Australia's competitive position in global LNG trade rests on a combination of scale, geographic advantage, and long-term contract discipline. Major operators including Chevron, Woodside Petroleum, Shell, Santos, and ConocoPhillips collectively manage Australia's entire export capacity, with each company embedded in multi-decade offtake agreements with Asian utilities and national oil companies. Export earnings of $65 billion in 2024-25 reflect both volume stability and historically elevated spot prices, though the medium-term outlook points to some moderation. LNG spot prices at $12.50/MMBtu in 2025 are forecast to ease to approximately $11/MMBtu by 2027 as new US and Qatari supply enters the market. Despite this price softening, volume forecasts remain intact, with production capacity expanding from 81 million tons in 2024 to 110 million tons by 2033. The Australian government's Future Gas Strategy explicitly targets maintenance of LNG export volumes as a strategic priority, recognizing gas as a transitional fuel bridging Asia's coal displacement ambitions. The broader Asia energy transition, covered in Ken Research's India smart grid study, contextualizes the long-horizon demand that sustains Australia's export economics. Producers are also investing in carbon capture and storage integration to extend the social license of LNG assets beyond 2040, positioning Australia as a supplier of lower-emissions LNG to markets with net-zero commitments.
- LNG export earnings decline from $65 billion in 2024-25 to approximately $47 billion by 2026-27 as spot prices moderate
- LNG spot price eases from $12.50/MMBtu in 2025 to approximately $11/MMBtu by 2027
- Volume resilience is maintained: production capacity grows from 81 million tons to 110 million tons by 2033
- Australian government's Future Gas Strategy designates LNG export continuity as a national economic priority through 2050
- Carbon capture integration is being piloted at Gorgon, targeting CO2 injection of up to 4 million tons per annum
- Australia competes directly with 3 major LNG export rivals: Qatar, US Gulf Coast, and Russia (Sakhalin)
Segments Powering Growth: Domestic, Export, and Emerging FLNG
The Australia LNG market comprises four structurally distinct segments, each with different growth drivers and risk profiles. The export segment dominates at over 90% of total production, generating $65 billion in annual earnings and driven by Asian demand under long-term contractual frameworks typically running 15-25 years. Domestic gas consumption, which underpins approximately 8.1 million tons of LNG equivalent demand in 2024, is expected to double to 17.2 million tons by 2033 as industrial gas demand grows alongside electrification of residential heating in New South Wales and Victoria. Australia's commercial building energy transition, tracked by Ken Research, reflects the domestic demand shift toward cleaner-burning gas from coal. The FLNG segment, pioneered through Shell's Prelude vessel, adds offshore processing flexibility with a nameplate capacity of 3.6 million tons per annum, enabling monetization of stranded gas reserves that were previously uneconomical to develop via fixed onshore infrastructure. Short-term and spot trade, though representing less than 10% of total volumes, plays an increasingly important price discovery role, with Australian cargoes frequently traded at Asia-Pacific hub benchmarks including JKM (Japan-Korea Marker). The Netherlands offshore wind study by Ken Research provides comparative context on how mature hydrocarbon exporters are managing the energy transition.
- Export segment: over 90% of total production, generating $65 billion in annual export earnings
- Domestic consumption: 8.1 million tons in 2024, doubling to 17.2 million tons by 2033
- FLNG technology: Prelude FLNG vessel capacity of 3.6 million tons per annum, enabling stranded reserve monetization
- Spot and short-term trade: less than 10% of volumes but growing as Asian utilities diversify supply portfolios
- LNG for marine bunkering is an emerging sub-segment with Australia's major ports planning bunkering infrastructure by 2027
Conclusion
Australia's LNG market is undergoing a measured but structurally sound expansion, grounded in geological endowment, geographic proximity to demand centers, and a contractual architecture built for multi-decade delivery. Ken Research finds the market advancing at a 8.1% CAGR through 2033, growing production from 81 million tons to 110 million tons as Asia's energy demand continues outpacing domestic supply. While spot price moderation from $12.50/MMBtu toward $11/MMBtu will compress earnings from the $65 billion peak, volume fundamentals remain intact. Western Australia's basin infrastructure, the government's Future Gas Strategy, and emerging FLNG and carbon capture investments collectively position Australia as an indispensable LNG supplier well into the 2040s. For investors, policy makers, and energy strategists tracking Asia's decarbonization pathway, the Australia LNG market represents one of the most consequential supply stories of the current decade.
Access Ken Research's comprehensive Australia LNG Market report for detailed capacity forecasts, operator profiles, contract analytics, and segment-level projections through 2033. Download the full report now.
Ken Research Finds
- Australia commands approximately 20% of global LNG trade, exporting 81 million tons annually in 2024
- Domestic consumption is forecast to more than double from 8.1 million tons to 17.2 million tons by 2033
- Western Australia's Carnarvon and Browse basins contribute roughly 57% of total national LNG output
- China alone absorbs 33% of Australian LNG exports, making it the single largest bilateral energy trade relationship by volume
- The LNG spot price of $12.50/MMBtu in 2025 underpins $65 billion in annual export earnings, Australia's second-largest export category
- FLNG capacity represented by Shell's Prelude vessel adds 3.6 million tons per annum from deepwater reserves previously uneconomical to develop
- Australia's government Future Gas Strategy targets LNG export continuity through 2050, providing regulatory certainty for multi-decade capital commitments
- Australia's broader investment landscape, including energy infrastructure assets, is tracked comprehensively by Ken Research
Q1: What is the current size of Australia's LNG market and how fast is it growing?
Australia's LNG market recorded production capacity of 81 million tons in 2024, equivalent to roughly 20% of global LNG trade. Domestic consumption stands at 8.1 million tons in the same year. The market is expanding at a 8.1% CAGR through 2033, when production capacity is forecast to reach 110 million tons and domestic consumption will reach 17.2 million tons. Export earnings peaked near $65 billion in 2024-25.
Q2: Which countries buy the most Australian LNG and why?
Asian economies dominate Australian LNG imports. China is the largest buyer at 33% of export volumes, driven by industrial demand and urban gas network buildout. Japan follows at 32%, anchored by 30+ long-term supply contracts. South Korea takes 15% and Taiwan 10%, collectively with China and Japan accounting for over 90% of all exports. Geographic proximity of under 1,500 nautical miles to Japan and Korea gives Australian cargoes a natural freight advantage of 5-7 days over Atlantic Basin competitors.
Q3: What are the key drivers of Australia's LNG production growth?
Five structural factors drive growth: first, vast proved natural gas reserves in the Carnarvon and Browse basins that underpin 57% of national production; second, Asia's structural energy demand gap that absorbs 90%+ of Australian LNG output; third, long-term contractual frameworks averaging 15-25 years providing revenue certainty; fourth, FLNG technology enabling monetization of stranded reserves with Prelude contributing 3.6 million tons per annum; and fifth, the Australian government's Future Gas Strategy prioritizing export continuity through 2050.
Q4: How does Australia's LNG market compare to Qatar and the United States?
Australia, Qatar, and the United States each account for roughly 20% of global LNG trade, forming a three-way oligopoly. Australia exported approximately 81 million tons in 2024, comparable to US and Qatari volumes. However, new Qatari North Field expansion projects targeting an additional 49 million tons per annum by 2030 and US Gulf Coast capacity additions of over 60 million tons per annum by 2030 will pressure spot prices from $12.50/MMBtu toward $11/MMBtu, making Australia's contracted volume strategy increasingly important versus spot exposure.
Q5: What is the outlook for Australian LNG beyond 2030?
Beyond 2030, Australia's LNG position will be defined by three forces: contract renewal risk as 2035-2040 offtake agreements expire, carbon compliance requirements as Asian utilities target net-zero LNG procurement, and FLNG expansion into Browse Basin deepwater reserves. Domestic consumption growth from 8.1 million tons in 2024 to 17.2 million tons by 2033 will partially offset any export volume decline. Carbon capture at Gorgon targeting 4 million tons per annum of CO2 injection, combined with potential hydrogen co-production, positions Australian operators to supply low-carbon LNG at a premium. Ken Research also tracks competing renewable energy supply chains that will interact with LNG demand dynamics through 2040.
Explore Ken Research's full suite of energy market intelligence reports covering LNG, renewables, and infrastructure across Asia-Pacific. Request a custom briefing today.


Comments
Post a Comment